


A ‘Well To Wheel’ (WtW) analysis allows us to compare the environmental impact of different vehicles. In short, it considers the total energy cost of a car, from digging oil in a well, to the manufacture of the vehicle, to the vehicle being driven until it is scrapped. In this article, I will examine a WtW argument put forward by automotive giant Mazda, regarding whether EVs are indeed better for the environment.
Recently, Mazda proposed its electrifying strategy in a long term technology development plan titled ‘Sustainable “Zoom-Zoom” announcement 2030’. In this plan, the following sentence, shown in the company’s CSR section, caught my attention.
CO2 emissions from ICE vehicles and EVs with small batteries became similar in their later life cycle, since EV batteries need to be replaced.
Is this claim true?
To support this claim, Mazda referred to a research paper titled ‘Estimation of CO2 Emissions of Internal Combustion Engine Vehicle and Battery Electric Vehicle Using LCA’, which was conducted by 5 Mazda employees and 2 researchers from Kogakuin university. However, upon investigating this paper, I found some of the assumptions to be out-dated. In this article, I will adopt the formulas used in Mazda’s paper to simulate a more realistic scenario, and ultimately demonstrate that, at least in Japan, EVs are better for the environment than ICEs, even if they have relatively big 75kWh batteries.
Contents
1. The assumptions
2. The emissions during the production of a lithium ion battery
3. Fuel Efficiency standard
4. The result
The assumptions
| (value unit; kg-CO2eq) | ICEs | EVs |
|---|---|---|
| Chassis | 4219 | 4219 |
| Engine | 1274 | 0 |
| Motor | 0 | 1070 |
| Inverter | 0 | 641 |
To build our scenario, we assume that an ICE vehicle and an EV share the same size, and that the total emissions produced in the manufacture of the chassis are the same. The ICE vehicle contains only its engine, while the EV contains a motor and an inverter. Other heavy components in the ICE vehicle, such as the transmission, exhaust system, and catalytic converter are excluded from this calculation. Of course, the EV also requires a battery, whose emissions I will calculate separately in the next chapter.
| Parts | The range between maintenance | "CO2 emission [kg-CO2/maintenance]" | Research paper |
|---|---|---|---|
| Tire | 40000 | 108 | JLCA |
| Lead-acid battery | 50000 | 19.5 | JLCA |
| Engine oil | 10000 | 3.22 | JLCA |
| Cooling water tank | 27000 | 7.03 | JLCA |
This table shows the emissions produced for maintenance of each component. Both ICE vehicles and EVs have tires and lead acid batteries. Motor oil and cooling water tanks are required only for the ICE vehicle. In both the original research paper, and this article, we ignore the maintenance of the braking system in ICE vehicles.
The research paper suggests batteries of EVs need to be replaced when the mileage has exceeded 160,000km. However, recent research conducted on 350 Tesla Model S vehicles shows that their batteries have degraded by only 10% after an average of 257,000km. Therefore, I am not including the cost of exchanging batteries in the total maintenance.
Finally, Mazda limits the end of a vehicles lifecycle to when it is dissembled for materials. They assume that the emissions for dissembling a gasoline car or an EV are the same. Therefore, I did not include this cost in my calculations.
However, I cannot ignore the emissions releases when a battery is disassembled, for which there is limited data available. The only research I could find is IVL 2017, which states a cost of 15kg-CO2eq/kWh. This suggests that the amount of CO2 produced by an EV with a 35.8kWh battery is 537kg, and 1125kg for 74kWh battery. These values will be added at the end of my calculation.
The amount of CO2 emission released during a lithium ion battery production
The following table shows the CO2 emissions created during production of an EV battery.
| Research paper | Battery type | CO2 emission[kg-CO2eq/kWh] |
|---|---|---|
| Zackrisson et al. | LFP | 166 |
| Majeau-Bettez et al. | NMC | 200 |
| LFP | 250 | |
| Amarakoon et al. | NMC | 121 |
| LFP | 151 | |
| Ellingsen et al. | NMC | 172 |
| The avarage value from Mazda | LFP/NMC | 177 |
|---|---|---|
| NMC avarage value from Mazda | NMC | 164 |
| IVL 2019 upper bound value | NMC | 106 |
| IVL 2019 median value | NMC | 83.5 |
The top chart shows the average emissions during production of an EV; this data was used in Mazda’s paper.
In the second chart, we calculate the average emissions for different battery types. The row “The average value from Mazda” excludes LFPs, which are not used for batteries in electric passenger cars in Japan, the US and Europe. The original paper includes China, and therefore included LFPs.
The data for IVL2019 is retrieved from this paper by the IVL Swedish Environmental Research Institute. Their research in 2017 shows the amount of emission per 1kWh battery was between 150 and 200kg, which is the same as Mazda’s paper. However, as a result of improved efficiency for battery production, the number has since been reduced to 61-106kg/kWh. In this article, I am going to use the upper bound of 106kg, and the average value of 83.5kg.
Fuel efficiency standard
In Mazda’s paper, the emissions are analyzed for various counties, whose respective fuel efficiency standards are often different. Japanese standard JC08 gives a big advantage to ICE vehicles by assuming a longer duration for engine idling time, less acceleration/braking, and an exemption from highway driving. This is an unrealistic standard, because few drivers use their cars in this manner.
The US EPA standard is used for both ICE and electric vehicles in this paper as a more fair and realistic measure. This standard also includes inefficiencies in the charging/discharging of electricity. .
To compare efficiencies, lets take the Mazda 3 X Proactive with Skyactiv-X as an example of an ICE vehicle. I am going to calculate EPA fuel efficiency using its WLTC mode. WLTC is the international standard, and its accuracy is better than JC08. In general, the accuracy ranking is EPA > WLTC > JC08.
I do not use official EPA standards because this car is not available in the US. There is a formula made by David Roper to convert between WLTC and EPA, that suggests WLTC=EPA x 1.121. According to this formula, the EPA estimate of this car is 15.3km/l.
As an example of an EV, we consider the Tesla Model 3 Long Range. According to the EPA standard, its efficiency is 26kWh/100mi= 6.19km/kWh.
The result
The estimated CO2 emission from gasoline use is 2320g/l, according to a formula given by the Japanese Ministry of Finance and Environment.
In the WtW assessment, emissions produced at oil wells and refineries, the distribution to petrol stations, and the fuel used for generating electricity should be considered. Mazda refers to data provided by GaBi to estimate these emissions. This data is available for purchase, but licensing issues prohibit its publication to the general public. Therefore, the spreadsheet I used for my calculation cannot be shown directly in this paper.
Here is the result.
| Mileage | Battery capacity | 0km | 10000km | 20000km | 30000km | 40000km | 50000km | 60000km | 70000km | 80000km | 90000km | 100000km | 110000km | 120000km | 130000km | 140000km | 150000km | 160000km | 170000km | 180000km | 190000km | 200000km | |
|---|---|---|---|---|---|---|---|---|---|---|---|---|---|---|---|---|---|---|---|---|---|---|---|
| 1 | ICEs | 35.8kWh | 5,493 | 7,258 | 9,023 | 10,795 | 12,668 | 14,452 | 16,224 | 17,989 | 19,862 | 21,634 | 23,418 | 25,190 | 27,063 | 28,828 | 30,600 | 32,384 | 34,257 | 36,029 | 37,794 | 39,566 | 41,458 |
| 2 | EVs- Mazda paper | 35.8kWh | 12,255 | 13,266 | 14,277 | 15,289 | 16,408 | 17,439 | 18,450 | 19,461 | 20,581 | 21,592 | 22,623 | 23,634 | 24,753 | 25,765 | 26,776 | 27,807 | 28,926 | 29,937 | 30,949 | 31,960 | 33,099 |
| 3 | 75kWh | 19,180 | 20,191 | 21,203 | 22,214 | 23,333 | 24,364 | 25,375 | 26,387 | 27,506 | 28,517 | 29,548 | 30,559 | 31,679 | 32,690 | 33,701 | 34,732 | 35,851 | 36,863 | 37,874 | 38,885 | 40,024 | |
| 4 | EVs- 106kg-CO2eq/kWh | 75kWh | 13,880 | 14,891 | 15,903 | 16,914 | 18,033 | 19,064 | 20,075 | 21,087 | 22,206 | 23,217 | 24,248 | 25,259 | 26,379 | 27,390 | 28,401 | 29,432 | 30,551 | 31,563 | 32,574 | 33,585 | 34,724 |
| 5 | EVs- 84kg-CO2eq/kWh | 75kWh | 12,193 | 13,204 | 14,215 | 15,226 | 16,346 | 17,377 | 18,388 | 19,399 | 20,518 | 21,530 | 22,561 | 23,572 | 24,691 | 25,703 | 26,714 | 27,745 | 28,864 | 29,875 | 30,887 | 31,898 | 33,037 |
Scenarios 2 and 3 use the same assumptions as in Mazda’s paper. The new emission data from 2019 is adopted in scenarios 4 and 5, which use the upper bound of 106kg-CO2eq/kWh, and average value 83.5kg-CO2eq/kWh respectively.
When an EV’s lifecycle is completed, the disassembly emissions of 537kg for 35.8kWh battery and 1125kg for 75kWh are added.
In scenarios 2 and 5, EVs have less emissions when they reach the mileage of 90,000km, scenario 4 at 110,000km and scenario 3 at 190,000km. In summary, EVs emit more emissions early in their lifecycle, as brand-new products delivered from the manufacturer. However, beyond a range of 90,000km, the cost of EVs is less than ICE vehicles, if including Mazda’s assumptions on the emissions released during battery production.
Specifically, in scenario 5 where we use the most realistic value of 83.5kg-CO2eq/kWh from IVL 2019, we find that the Model 3 releases less emissions than a MAZDA3 X PROACTIVE beyond a range of 90,000km. The total amount is 110,000kg, including emissions during recycling when the car is no longer in use.
Therefore, is it possible to conclude that ICE vehicles and EVs have the same emissions across their lifecycles from well to wheel, or that EVs have less if you drive for more than 90,000km?
As of early 2020, yes, but things are set to change in the near future.
We use the average value of 86g from IVL 2019 in this article. However, companies like Tesla, Volkswagen and Northvolt are committed to use only renewable energy in their battery production. In this case, the emissions of battery production can be estimated as 61g-CO2eq/kWh, which is 27% less than if we use the IVL2019 average value. This does not account for utility companies, who are also trying to reduce their emissions.
Therefore, as long as renewable energy plays an increasingly larger role in the EV lifecycle, their total emissions from Well to Wheel will continue to reduce.
The widening gap between the total emissions of EVs and ICEs
In the previous chapter, I compared EVs and ICEs available in Japan, and demonstrated that EVs will release less CO2 emissions throughout their lifespan. Now, I expand this analysis to the US, EU and China.
In order to compare each country, I used CO2 Emission Intensity data obtained from GaBi. The data is from 2016, and the gasoline used in this scenario is of regular type.
We compare two cars: the MAZDA 3 X PROACTIVE (with SKYACTIVE-X) and the Tesla Model 3 LR. According to IVL2019, the average emissions produced during battery production is 83.5kg-CO2eq/kWh; therefore, the 75kWh battery of the Tesla produced 6262.5kg.
| Mileage | 0 | 10000 | 20000 | 30000 | 40000 | 50000 | 60000 | 70000 | 80000 | 90000 | 100000 | 110000 | 120000 | 130000 | 140000 | 150000 | 160000 | 170000 | 180000 | 190000 | 200000 | 210000 | 220000 | 230000 | 240000 | 250000 |
|---|---|---|---|---|---|---|---|---|---|---|---|---|---|---|---|---|---|---|---|---|---|---|---|---|---|---|
| ICEs(JP) | 5493 | 7258 | 9023 | 10795 | 12668 | 14452 | 16224 | 17989 | 19862 | 21634 | 23418 | 25190 | 27063 | 28828 | 30600 | 32384 | 34257 | 36029 | 37794 | 39566 | 41458 | 43223 | 44995 | 46760 | 48632 | 50424 |
| EVs(JP) | 12193 | 13204 | 14215 | 15226 | 16346 | 17377 | 18388 | 19399 | 20518 | 21530 | 22561 | 23572 | 24691 | 25703 | 26714 | 27745 | 28864 | 29875 | 30887 | 31898 | 33037 | 34048 | 35059 | 36071 | 37190 | 38221 |
| ICEs(US) | 5493 | 7343 | 9194 | 11051 | 13009 | 14879 | 16736 | 18586 | 20545 | 22402 | 24272 | 26129 | 28087 | 29938 | 31795 | 33665 | 35623 | 37480 | 39330 | 41188 | 43165 | 45016 | 46873 | 48723 | 50682 | 52558 |
| EVs(US) | 10505 | 11339 | 12172 | 13006 | 13947 | 14801 | 15634 | 16468 | 17409 | 18243 | 19096 | 19930 | 20871 | 21705 | 22538 | 23392 | 24333 | 25167 | 26000 | 26834 | 27795 | 28629 | 29462 | 30296 | 31237 | 32091 |
| ICEs(EU-28) | 5493 | 7311 | 9130 | 10955 | 12881 | 14719 | 16545 | 18363 | 20289 | 22115 | 23952 | 25778 | 27704 | 29522 | 31348 | 33186 | 35112 | 36937 | 38756 | 40581 | 42527 | 44345 | 46170 | 47989 | 49915 | 51760 |
| EVs(EU-28) | 10505 | 11111 | 11717 | 12322 | 13036 | 13662 | 14267 | 14873 | 15587 | 16193 | 16818 | 17424 | 18138 | 18744 | 19349 | 19975 | 20689 | 21294 | 21900 | 22506 | 23239 | 23845 | 24451 | 25057 | 25771 | 26396 |
| ICEs(CN) | 5493 | 7226 | 8959 | 10699 | 12540 | 14292 | 16032 | 17765 | 19606 | 21346 | 23099 | 24839 | 26680 | 28412 | 30152 | 31905 | 33746 | 35486 | 37219 | 38959 | 40819 | 42552 | 44292 | 46025 | 47866 | 49625 |
| EVs(CN) | 10505 | 11718 | 12931 | 14145 | 15466 | 16699 | 17912 | 19125 | 20446 | 21660 | 22892 | 24106 | 25427 |
This chart shows the total emissions per car in each region. EU28 indicates the average value of 28 EU countries. In the US and EU, the total lifespan emissions of EVs become less than those of ICEs when the mileage reach at 50,000km. This mileage is about 90,000km in Japan and 100,000km in China.
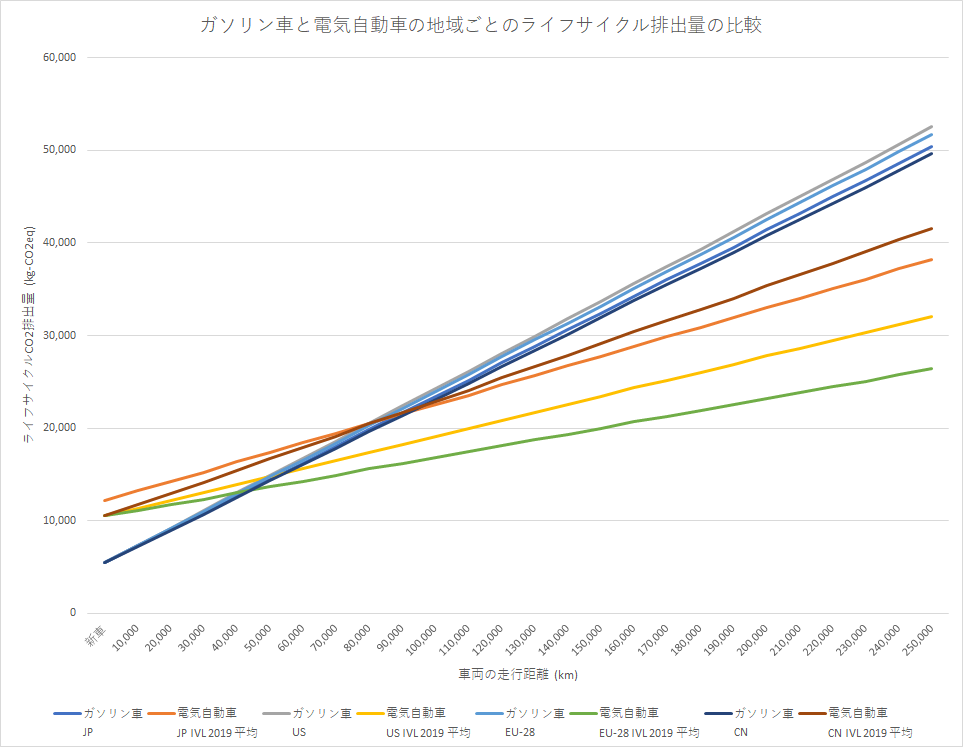
The lines in this graph represent ICEs in the US (gray line) and China (blue), and EVs in China (brown), Japan (orange), US (yellow) and the EU (green). At 0km mileage, EVs have generally produced more emission up to that point in their lifespan. As EVs are driven by the typical user, however, the rate at which emissions grow is markedly less compared to ICEs. Again, the mileage at which EVs become “greener” lies between 50,000km and 100,000km.
This comparison assumes that a given car will release, on average, the same emissions per year of driving. However, society at large is taking actions to reduce C02 emissions in the long term. How would this affect our analysis?
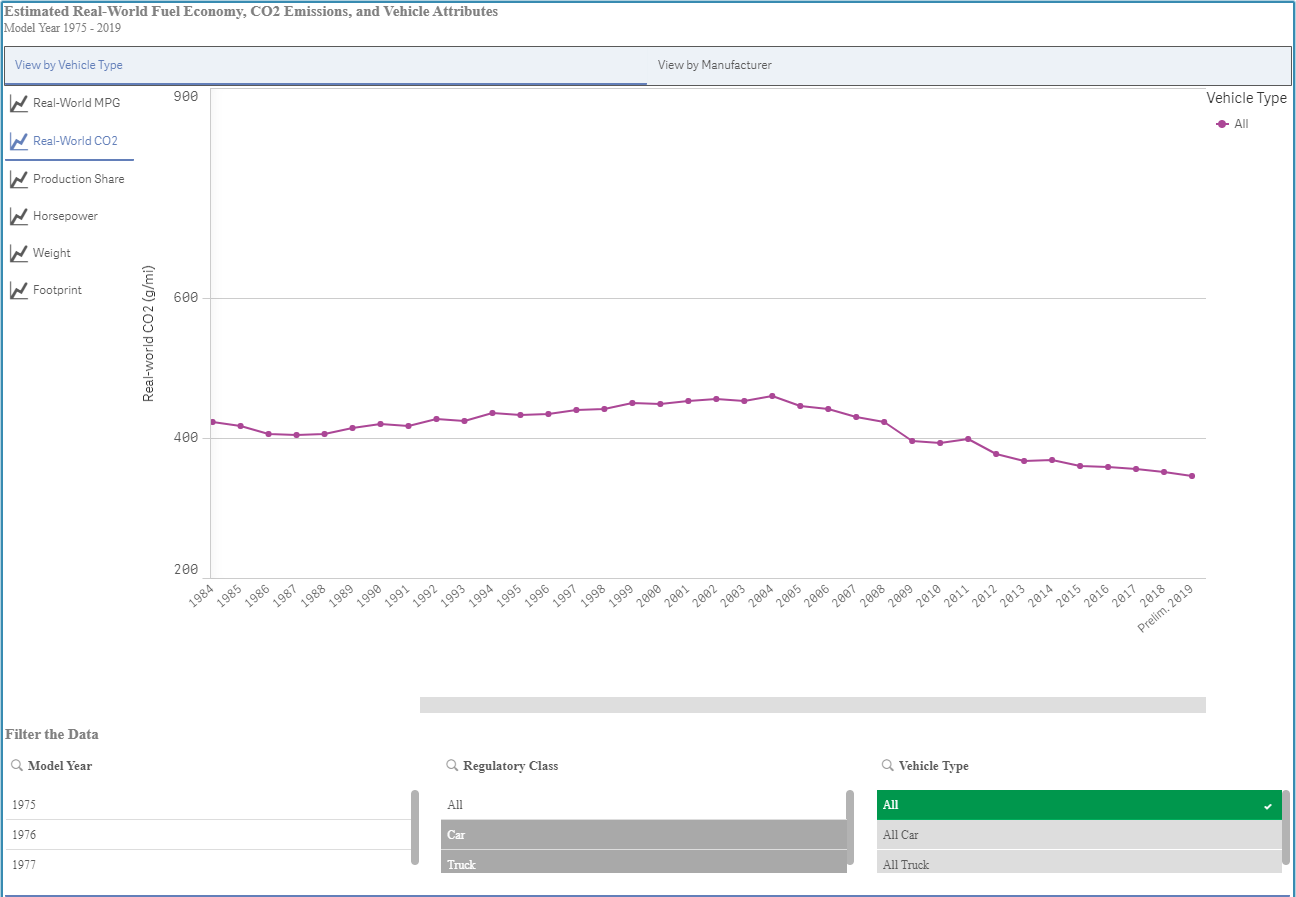
It has proven difficult to reduce emissions produced during mining, delivering and refining gasoline. Therefore, improving fuel efficiency has been a key strategy to reduce total ICE emissions. Indeed, we show in this graph that average emissions for ICEs have declined significantly since 2004, falling from 461g/mi to 346g/mi in 2019. This represents a 7.67g/mi reduction, or 1.7% per year.
Further reductions in CO2 emissions from power generation are possible
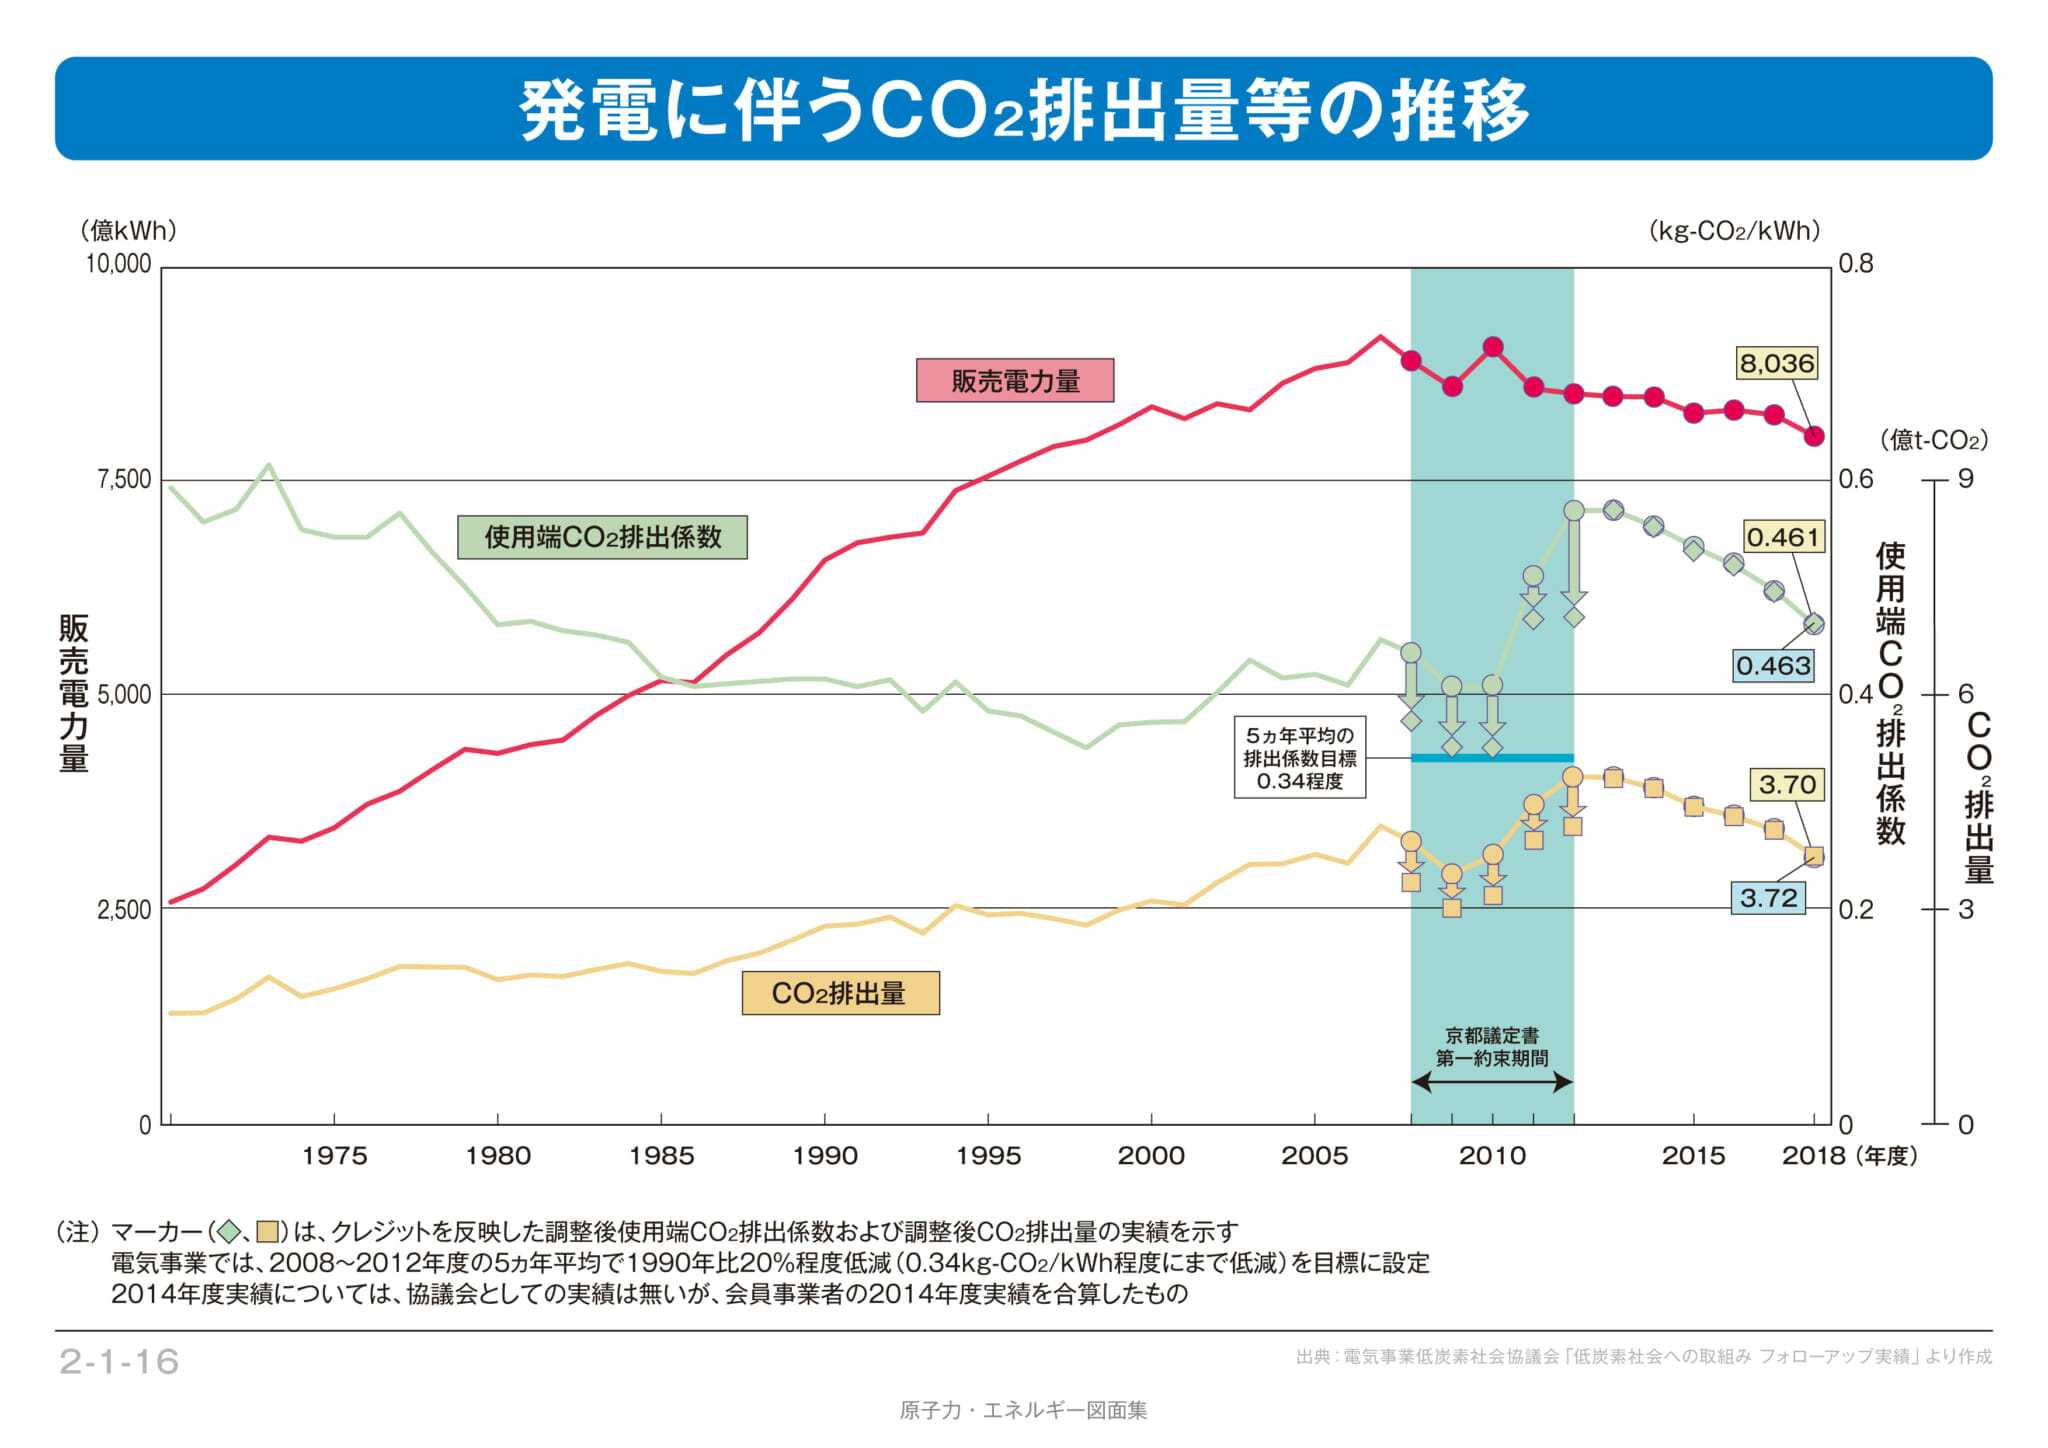
Efforts to reduce the total emissions of EVs focus on either battery production or power generation. In general, the emissions from power productions have decreased in recent years. The graph above shows the CO2 emissions in Japan since 1970, including a turbulent period following the Fukushima Nuclear Power plant disaster in 2011, after which most nuclear power plants stopped activity. However, the total emissions have reduced from 552g/kWh to 463g/kWh, representing a 3.2% reduction per year on average.
Furthermore, market forces will continue to make power generation an increasingly economical solution. According to Carbon Tracker, ‘Renewables are outcompeting coal around the world and proposed coal investments risk becoming stranded assets which could lock in high-cost coal power for decades. The market is driving the low-carbon energy transition but governments aren’t listening. It makes economic sense for governments to cancel new coal projects immediately and progressively phase out existing plants.’
In this table, we compare the projected reductions in total emissions for ICEs and EVs, in 2030 and 2050, assuming current market trends persist.
| 2020 | 2030 | 2050 | |
|---|---|---|---|
| Gasoline cars/ 1.7% reduction per year | 1 | -0.17 | -0.51 |
| EVs/3.2% reduction per year | 1 | -0.32 | -0.96 |
The total emission of all EVs will be reduced
Whilst these projections already favor EVs, they likely overestimate the actual reduction in emissions of ICEs on the road.
In Japan, about 5 million new cars are sold every year, and 60 million cars are on the road. If the number of cars on the road remains constant, it will take about 12 years to replace them. This means that, by 2030, the actual reduction in total emissions from ICEs will be closer to about 8.5%, because there will still be a significant amount of older, less efficient ICEs on the road.
On the other hand, all EVs on the road will benefit from the improving efficiency of power generation. By 2030, the reduction in emissions of 32%, compared to today, will apply to both brand new and classic 2009 EV cars.
Conclusion
We conclude that in all regions we have considered, there is strong evidence that CO2 emissions from an EV bought today will be less, across its lifetime, than a comparable ICE. And within only 10 years, the projected gap between ICEs and EVs will be substantial, further highlighting the need to society to shift rapidly towards EVs.
(Hiroshi Yasukawa)


コメント
コメント一覧 (1件)
Excellent analysis, Hiroshi! Very enjoyable and informative read!
I have always been a huge fan of Mazda’s sense of styling and the overall driving experience. Unfortunately, though, their lack of initiative in the BEV/PHEV sector is VERY disappointing. Can you imagine how popular an electric Atenza would be?! OMG!